Every behavioral insight. No data team required.
From auto-discovered retention sequences to deep cohort funnel drilldowns — Prodlytix gives product and growth PMs the full behavioral picture in hours, not sprints.
ML detects your retention sequence automatically
Point Prodlytix at your event stream. Our algorithm identifies the shortest behavioral path shared by your highest-retained users — typically a 3 to 5-step sequence — and ranks it by predictive power.
- Processes millions of event paths in under 4 hours
- No schema setup — works on raw event names
- Sequences ranked by 30-day retention correlation
- Weekly re-runs as your user base evolves
A note on correlation vs. causation: Prodlytix surfaces behavioral correlations — event sequences that co-occur with higher retention rates in your user data. Correlation is not causation. To confirm that a sequence causes retention, run a controlled experiment. Prodlytix tells you what to test; your experiment framework tells you whether it works.

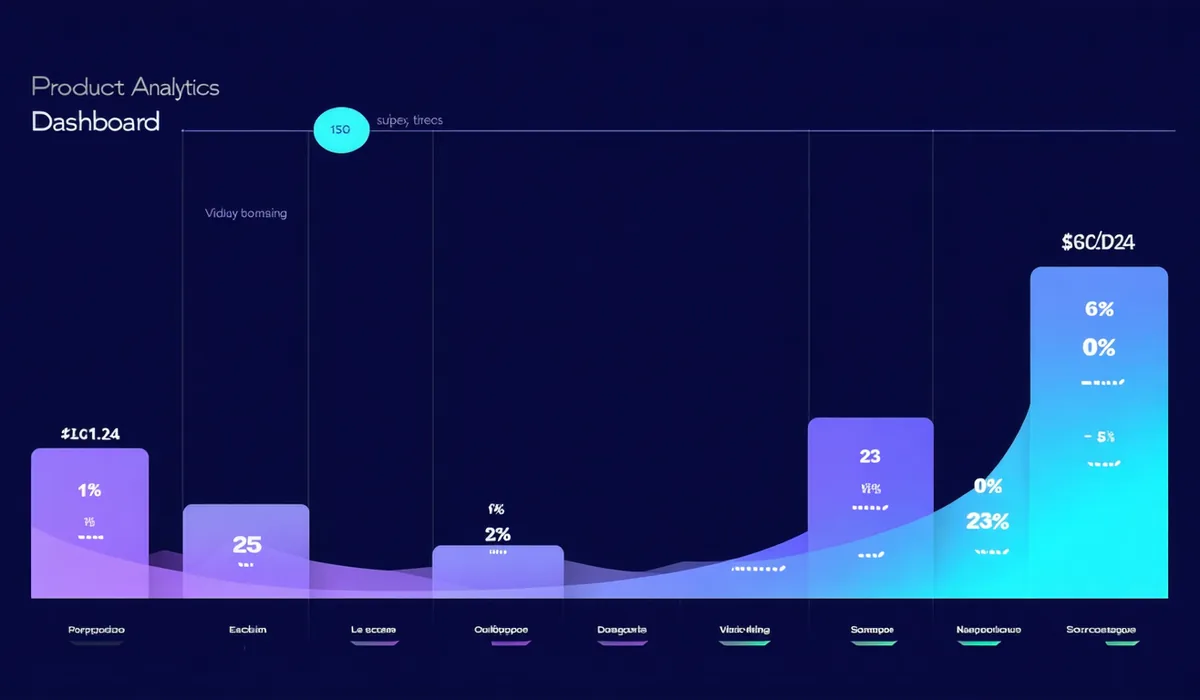
Build funnels without SQL. Find drop-offs in seconds.
Drag and drop any event into your funnel. Compare conversion rates across cohorts, A/B test groups, or time windows. Drill into the user sessions behind every drop-off point.
- Unlimited funnel steps — from signup to upgrade and beyond
- Cohort overlays on every funnel view
- Time-window comparison (before/after release)
- Click to view individual sessions at any step
Group users by what they do — not who they are
Traditional cohorts segment by signup date or plan. Prodlytix cohorts segment by behavior: users who completed onboarding step 3, users who triggered the key activation event, users who exported before day 7.
- Define cohorts using any event or event sequence
- Overlay cohort retention curves side-by-side
- Export cohort lists to your CRM or marketing tools
- Auto-generated "activated" vs "not activated" cohort every time you run auto-discovery
See every route through your product
Pick any event. Path Explorer shows you every sequence of events that leads to it — and every sequence that follows it. Discover unexpected routes to value and dead-ends that lead to churn.
- Upstream and downstream path views
- Filter by cohort, time window, or user property
- Weighted by user count — see the busy routes
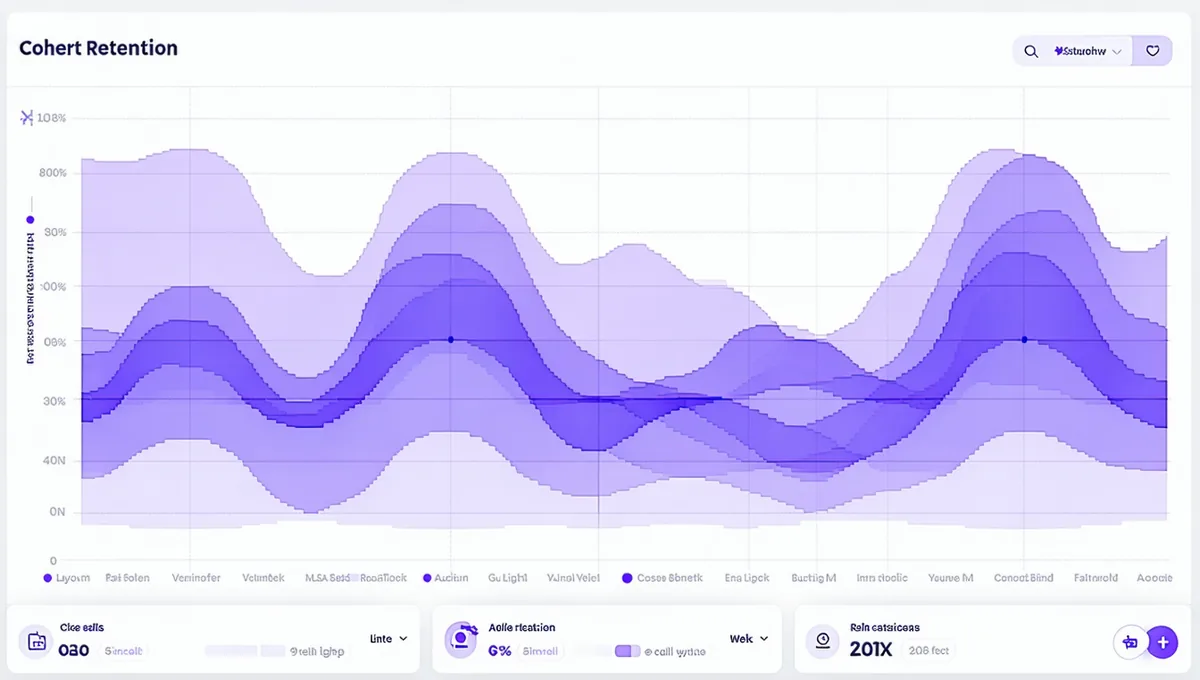
See which product changes actually moved retention
Track N-day retention for any cohort. Overlay different cohorts on the same chart. Mark your releases, experiments, and onboarding changes — then see the exact curve shift they caused.
- 7, 14, 30, 60, 90-day retention tracking
- Release markers pinned to retention timeline
- Cohort curves overlaid side-by-side
- Exportable as PNG or CSV for sharing with stakeholders
Ready to find your retention sequence?
Install the SDK in under 10 minutes. First insights in 4 hours.